Strain Hardening Simulation on CPU
We can run a tensile test simulation of a single-crystal Cu using the following commands (running ExaDiS on CPU). This type of simulation is also called the strain-hardening simulation because it predicts stress-strain curves in the plastic regime where the flow stress increases with strain.
cd ${OPENDIS_DIR}
cd examples/10_strain_hardening/
export OMP_NUM_THREADS=8
python3 test_strain_hardening_exadis.py
Initial Condition
The initial dislocation configuration for this simulation is read from a data file 180chains_16.10e.data (in ParaDiS data format) by the following Python commands
G = ExaDisNet()
G.read_paradis('180chains_16.10e.data')
The simulation cell size is 15 𝜇m × 15 𝜇m × 15 𝜇m, subjected to periodic boundary conditions in all three directions. The initial dislocation density is 𝜌0 ≈ 1.2 × 10¹² m-2. The initial dislocation structure can be visualized by Ovito as shown below. The dislocation lines are colored according to the dislocation character angle.
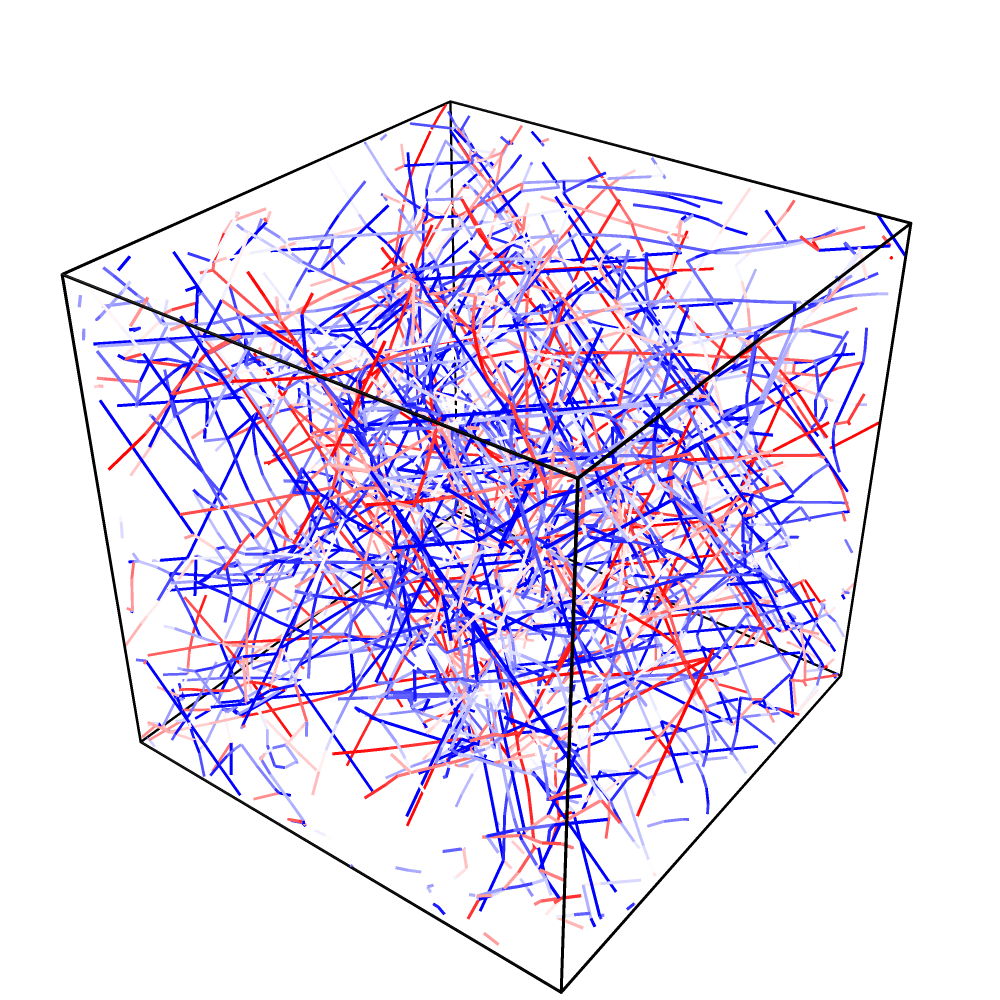
Click here to see the Ovito settings used to generate the plot above.
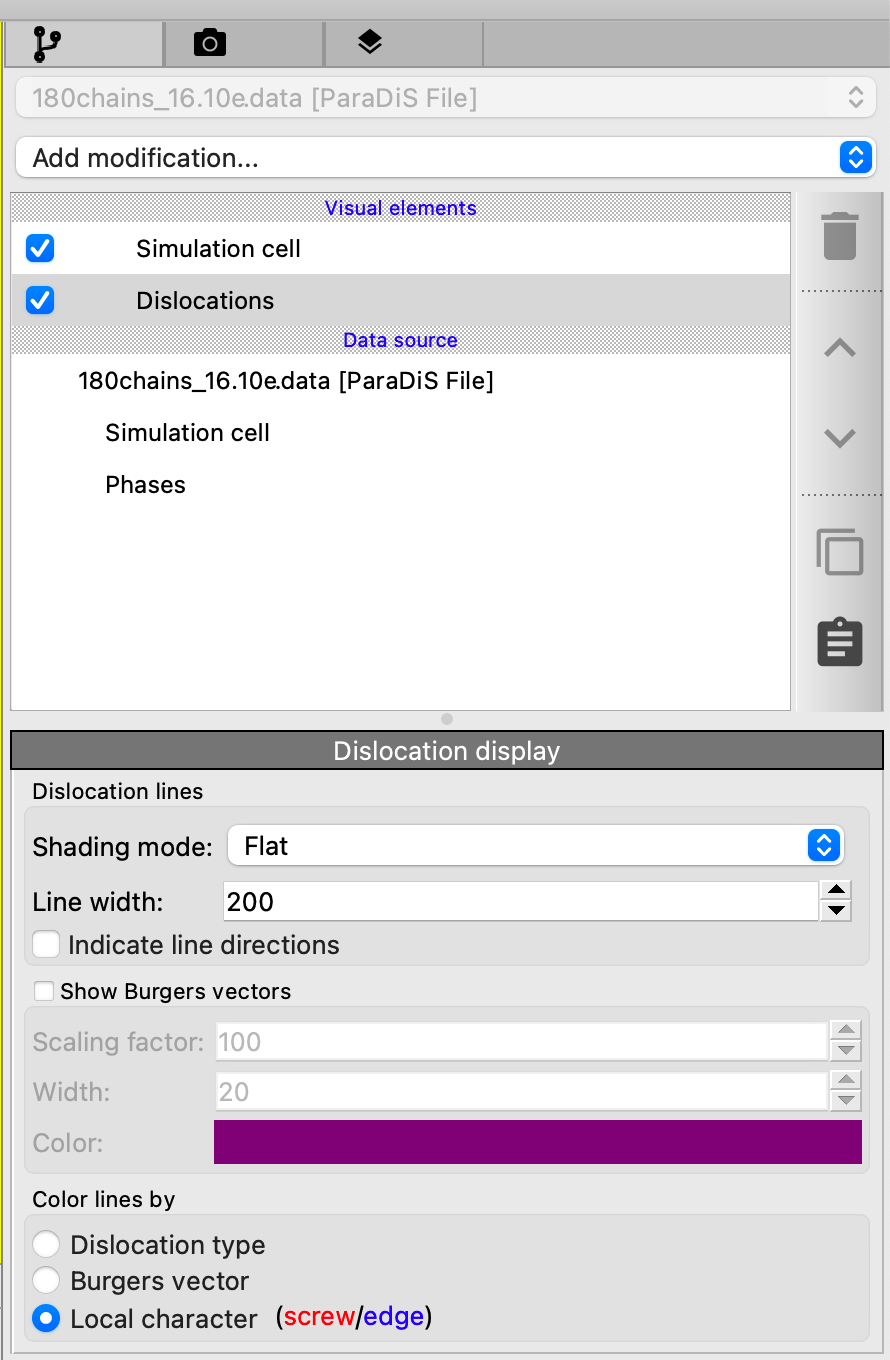
Simulation Setup
Many simulation parameters are specified in the dictionary variable state. The sim objects contains all the information, including the sub-modules of the simulation. In particular, max_strain specifies the maximum strain to be reached in the simulation (here running up to 0.01 = 1% strain). The following line in the Python program executes the simulation
sim.run(net, state)
Simulation Behavior
The simulation creates a folder called output_fcc_Cu_15um_1e3 to store the results files. On MC3.stanford.edu (with 8 OMP threads), it takes about 12 minutes to run the first 100 steps of the simulation.
To specify a different stopping criterion, we can modify the constructor for sim, e.g. by switching from max_strain=0.01 to max_step=1600 to run the simulation for 1600 time steps. The simulation takes about 21 hours on MC3.stanford.edu (with 8 OMP threads) to complete. The simulation will write a data file to the output folder for every 100 steps. The stress_strain_dens_1600_CPU.dat file stores certain essential information of the tensile test — here it contains 5 columns corresponding to step, strain, stress (Pa), dislocation density (m-2) and wall-clock time (sec), respectively.
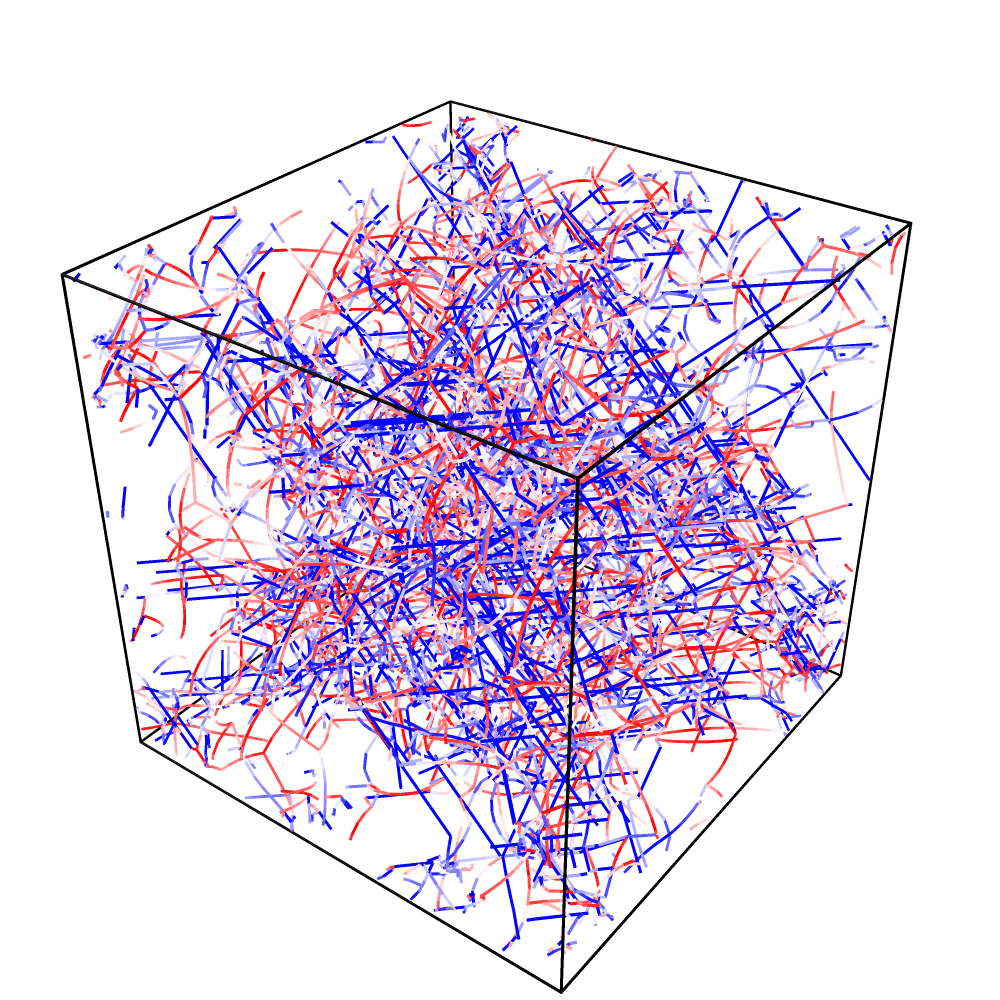
The final dislocation configuration (config.1600.data) after 1600 steps is shown below.
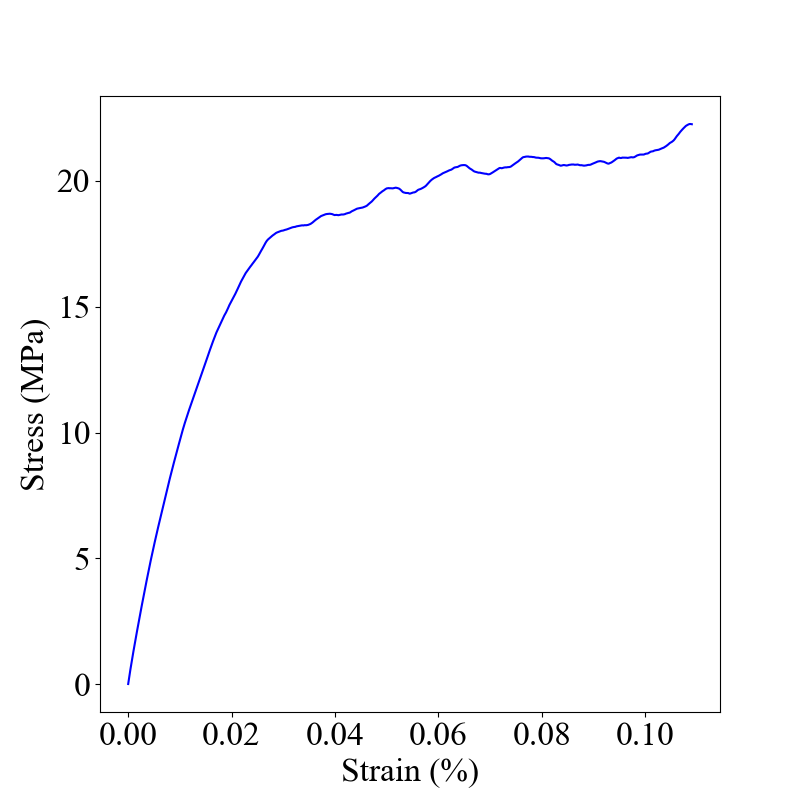
The predicted stress-strain curve is shown below.
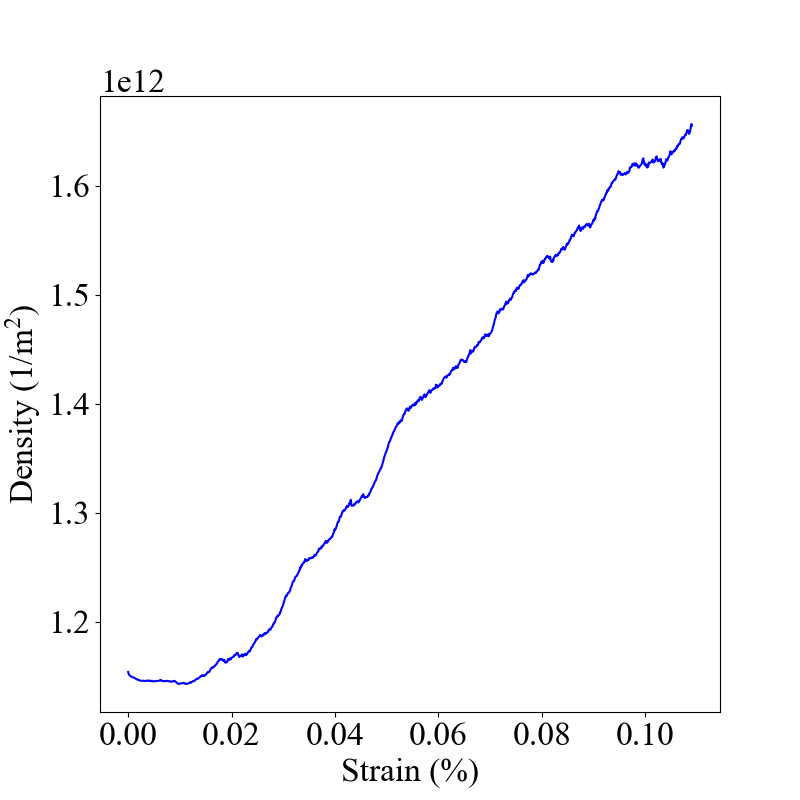
Here is how the total dislocation density changes with strain. The increase of dislocation density (i.e. dislocation multiplication) with strain is a key mechanism for strain-hardening.
Restart Simulation
The simulation produces a set of restart files in the output directory. We can restart the simulation from any of these restart files. For example,
cd ${OPENDIS_DIR}
cd examples/10_strain_hardening/
export OMP_NUM_THREADS=8
python3 test_strain_hardening_exadis.py 100
would restart the simulation from the file output_fcc_Cu_15um_1e3/restart.100.exadis.